
By Andrew Hsiung, Managing Director, Debt Capital Markets, Crux
For lenders underwriting clean energy projects, 2025 may have felt like two different years. The first half was defined by urgency — developers racing to safe harbor projects, construction pipelines moving, and capital deploying at a rapid clip. The second half brought hesitation after the passage of the One Big Beautiful Bill (OBBB) injected uncertainty into tax liabilities, buyer demand softened, and deal dynamics shifted.
Crux recently published The State of Clean Energy Finance: 2025 Market Intelligence Report, the latest in our series of market reports drawing on proprietary deal-level data across project finance debt, tax equity, and transferable tax credits. It's the most comprehensive picture of how clean energy was financed last year — and what's coming in 2026.
I want to walk through what I think matters most for lenders.
Total lending to clean power, fuels, and manufacturing projects reached approximately $120 billion in 2025, a 5.8% year-over-year increase. That's a meaningful feat given the policy volatility that defined the year. But it's also a slower growth rate than 2024's 22% increase, and the trajectory within the year tells a more nuanced story.
Total clean energy greenfield debt finance by type, 2023–2025
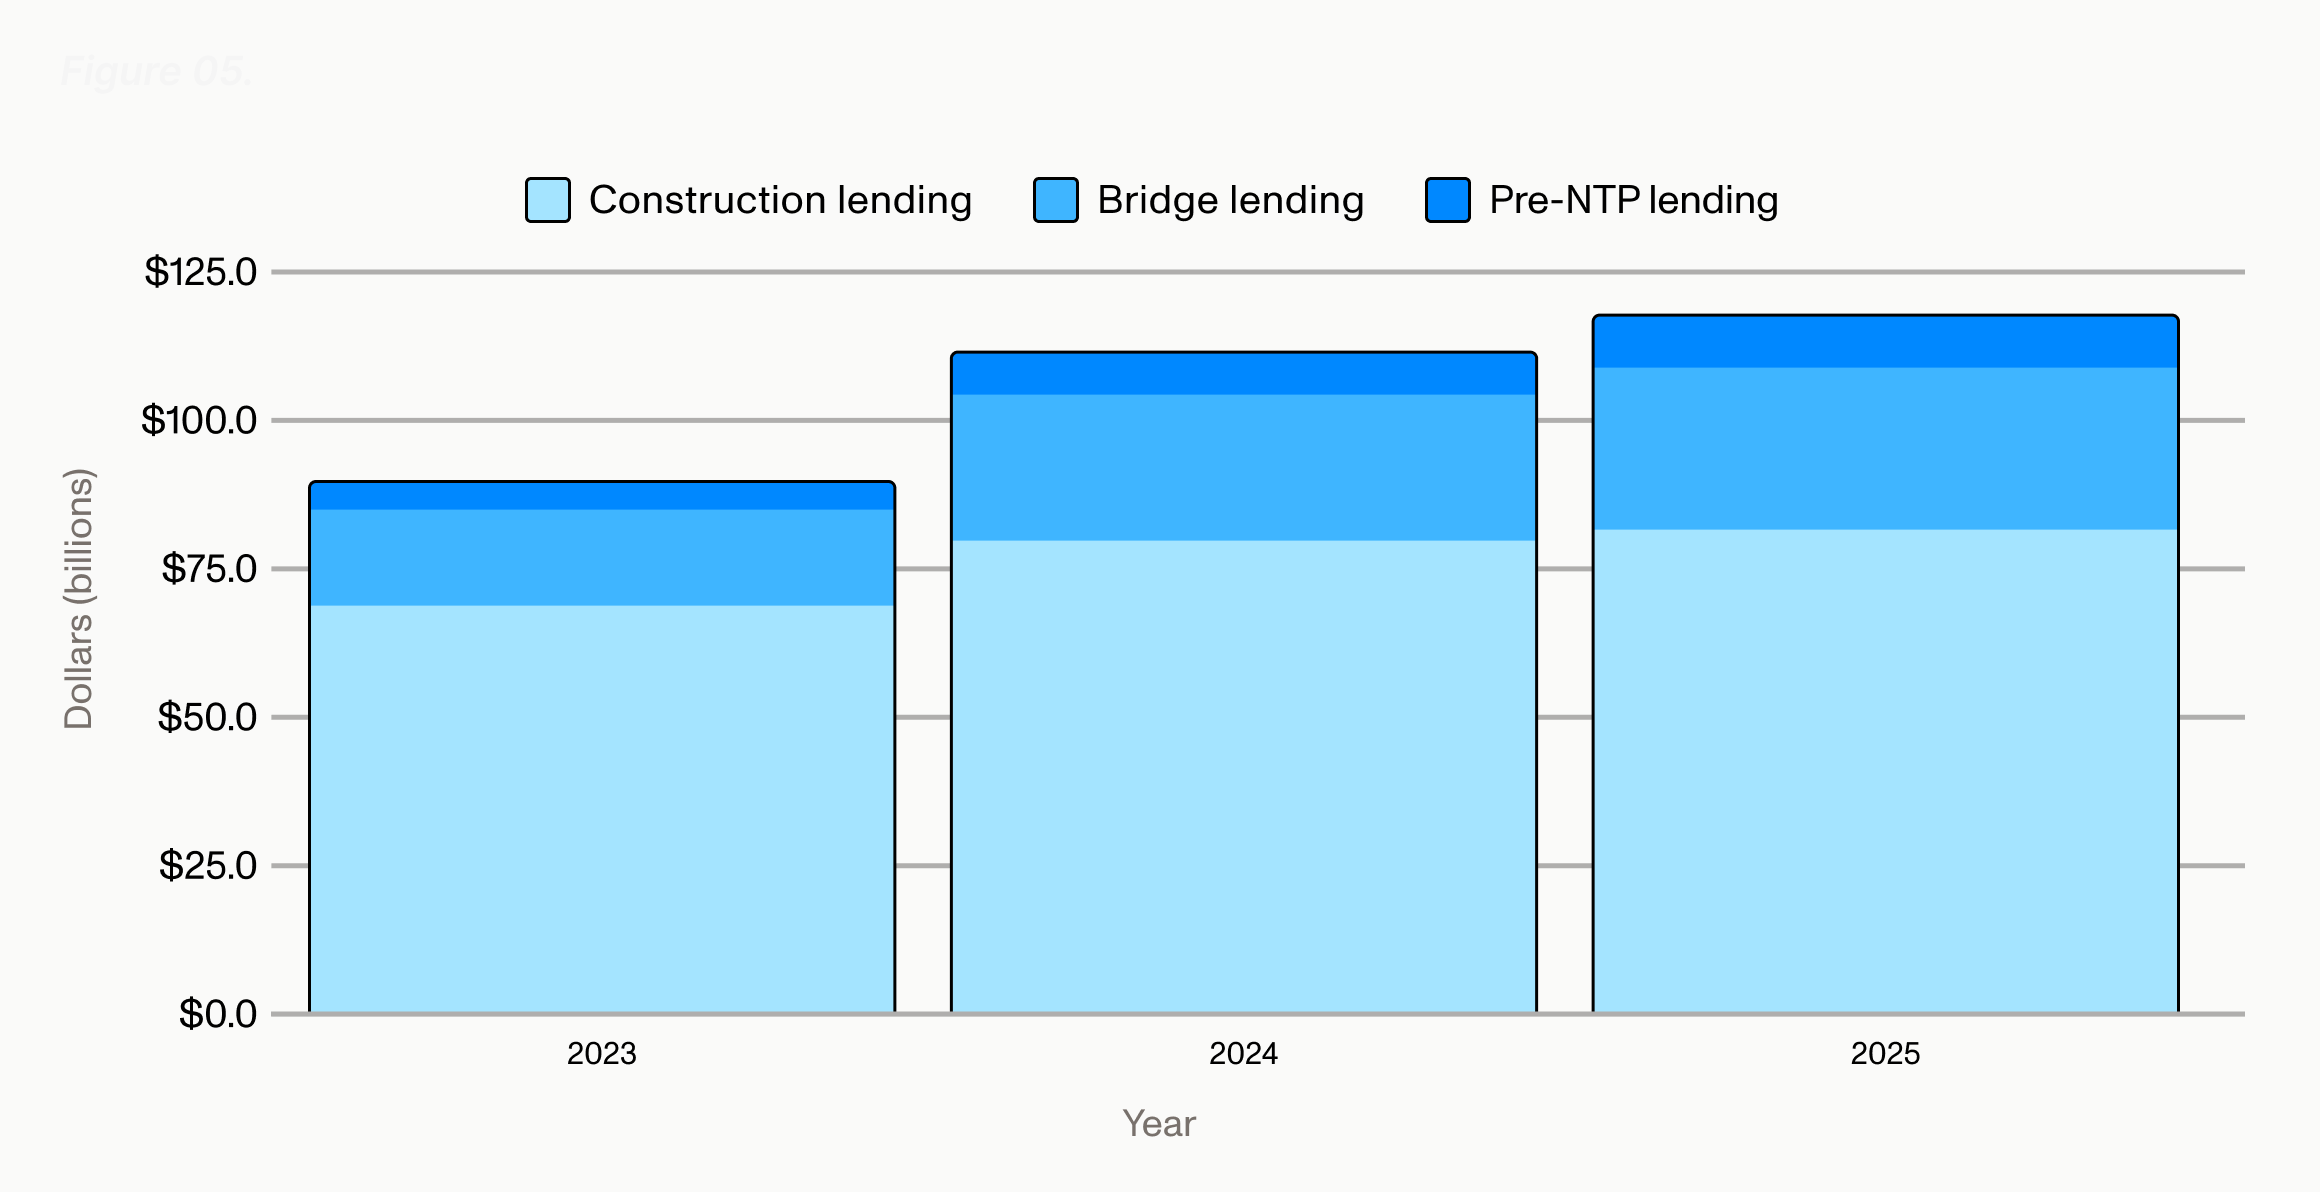
Investment peaked in Q1 and tapered through the middle of the year as market participants waited to see how the OBBB would shake out. Power sector investment was robust throughout, but increasingly concentrated among traditional solar, wind, and storage projects and experienced developers. Investment in manufacturing and fuels declined as policy uncertainty, tariff disruptions, and the loss of federal electric vehicle (EV) credits weighed on those segments.
Total estimated project finance debt investment by segment, 2023–2025
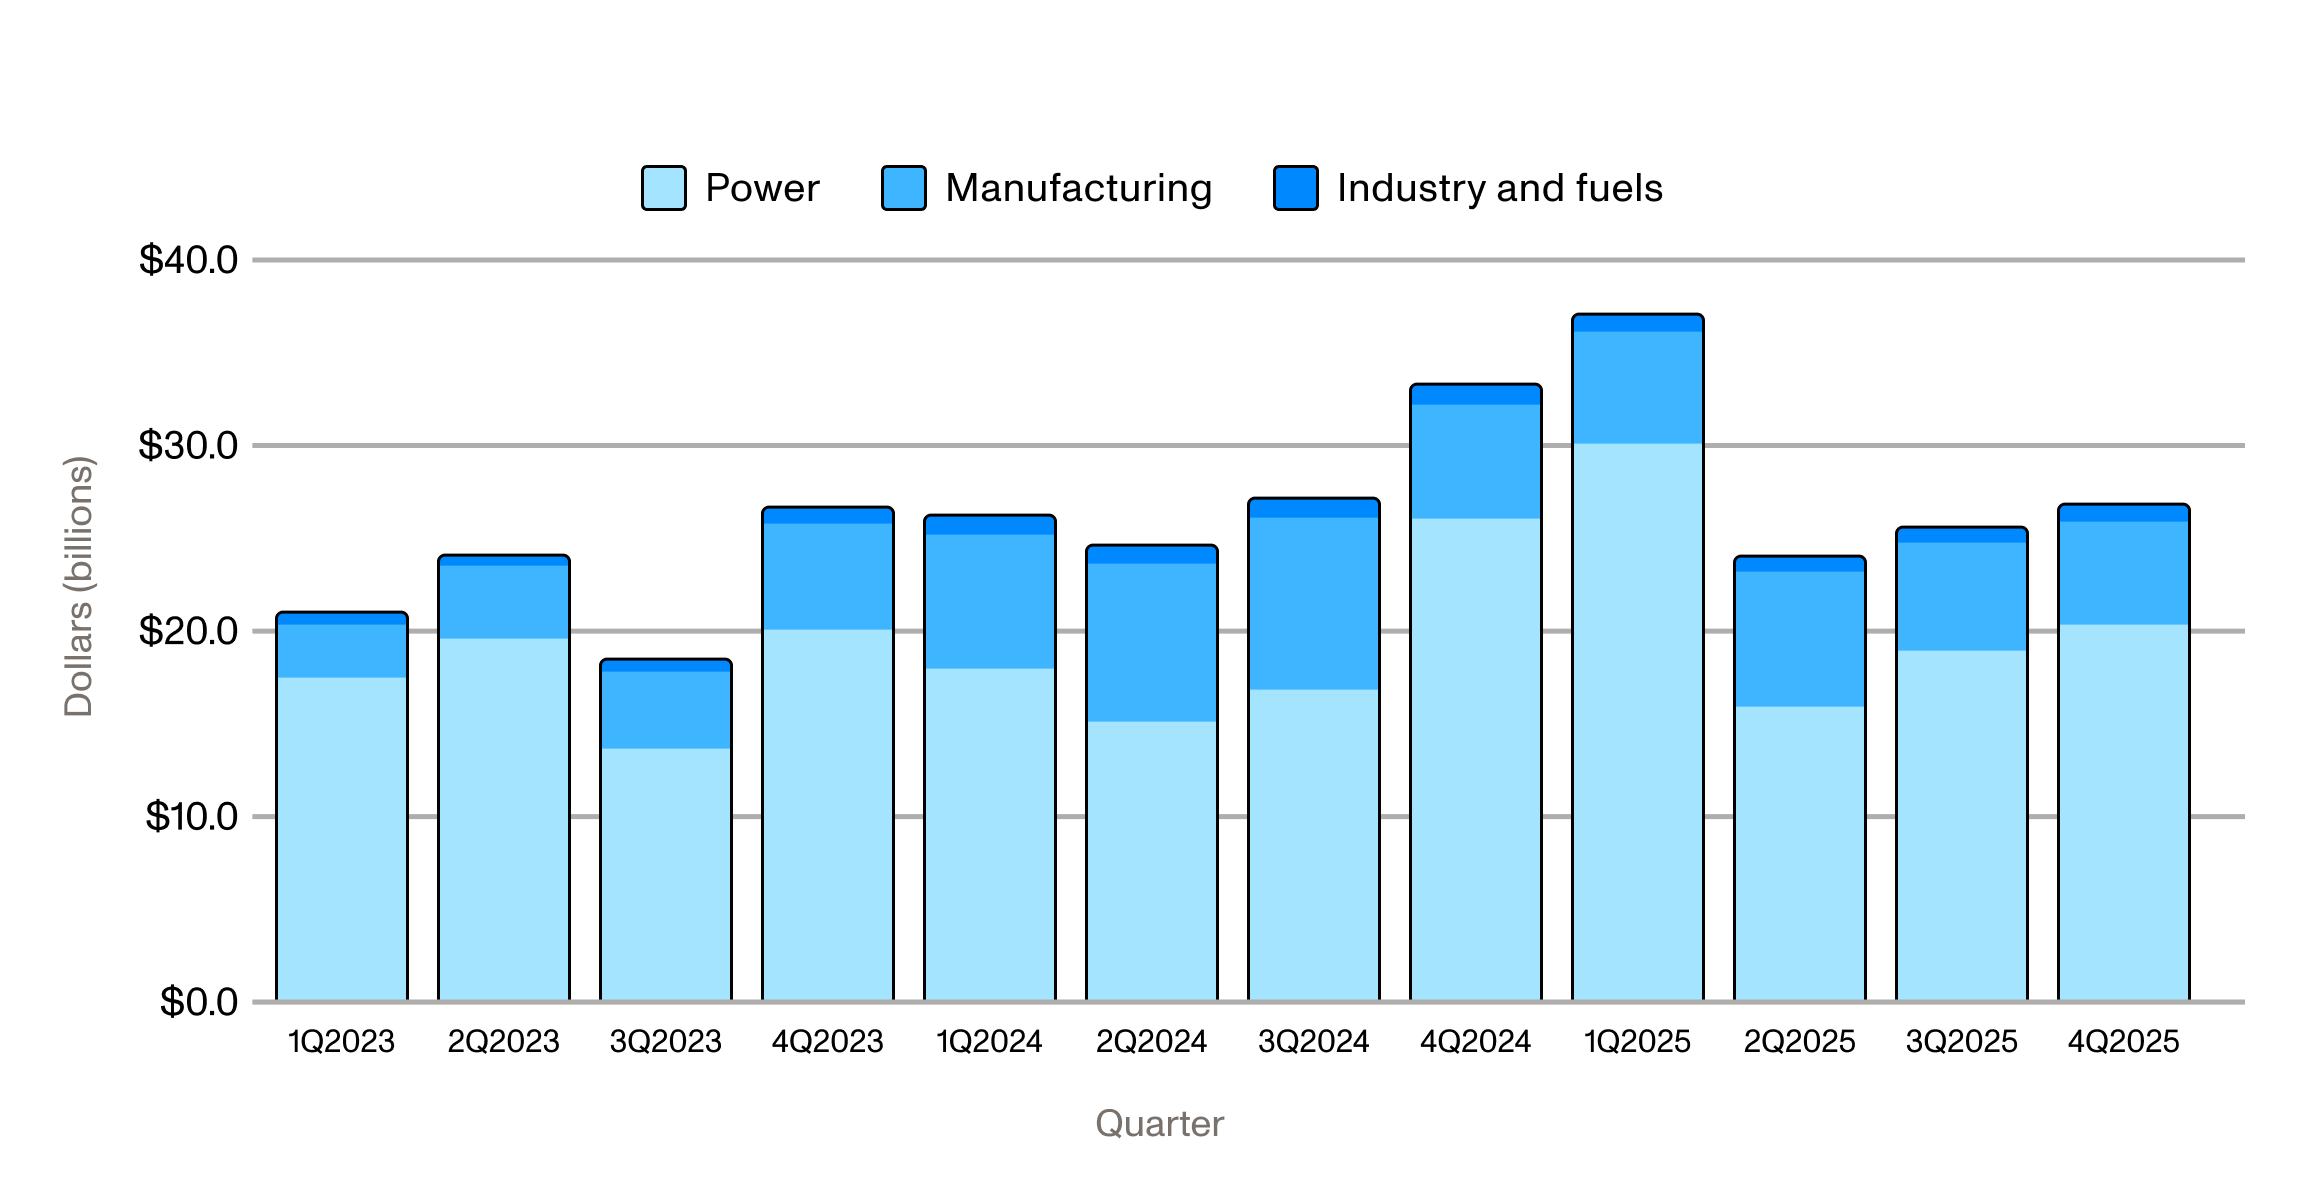
For lenders, the takeaway is straightforward: the market is growing, but it's growing selectively. Projects and sponsors with strong balance sheets, advanced development status, and proven track records continued to access financing on favorable terms. Everyone else faced higher costs or reduced availability.
This selectivity showed up clearly in pricing. Bank lending to clean energy remained relatively low-cost but was in limited supply. Meanwhile, private credit lenders stepped in to serve a wider variety of mid-scale and distributed platforms at meaningfully higher spreads — but with greater flexibility.
Pre-notice-to-proceed (pre-NTP) debt pricing provides a good example of this. Utility-scale solar projects from experienced sponsors saw pre-NTP pricing spreads from roughly 400–900 basis points (bps) above the secure overnight financing rate (SOFR) due to their well-established structure and stronger sponsors and offtakers. Commercial and industrial solar, residential solar, and battery storage priced higher (SOFR + 600–1,100) due to increased revenue risk, while pre-NTP capital for merchant projects remained highly selective and largely unavailable.
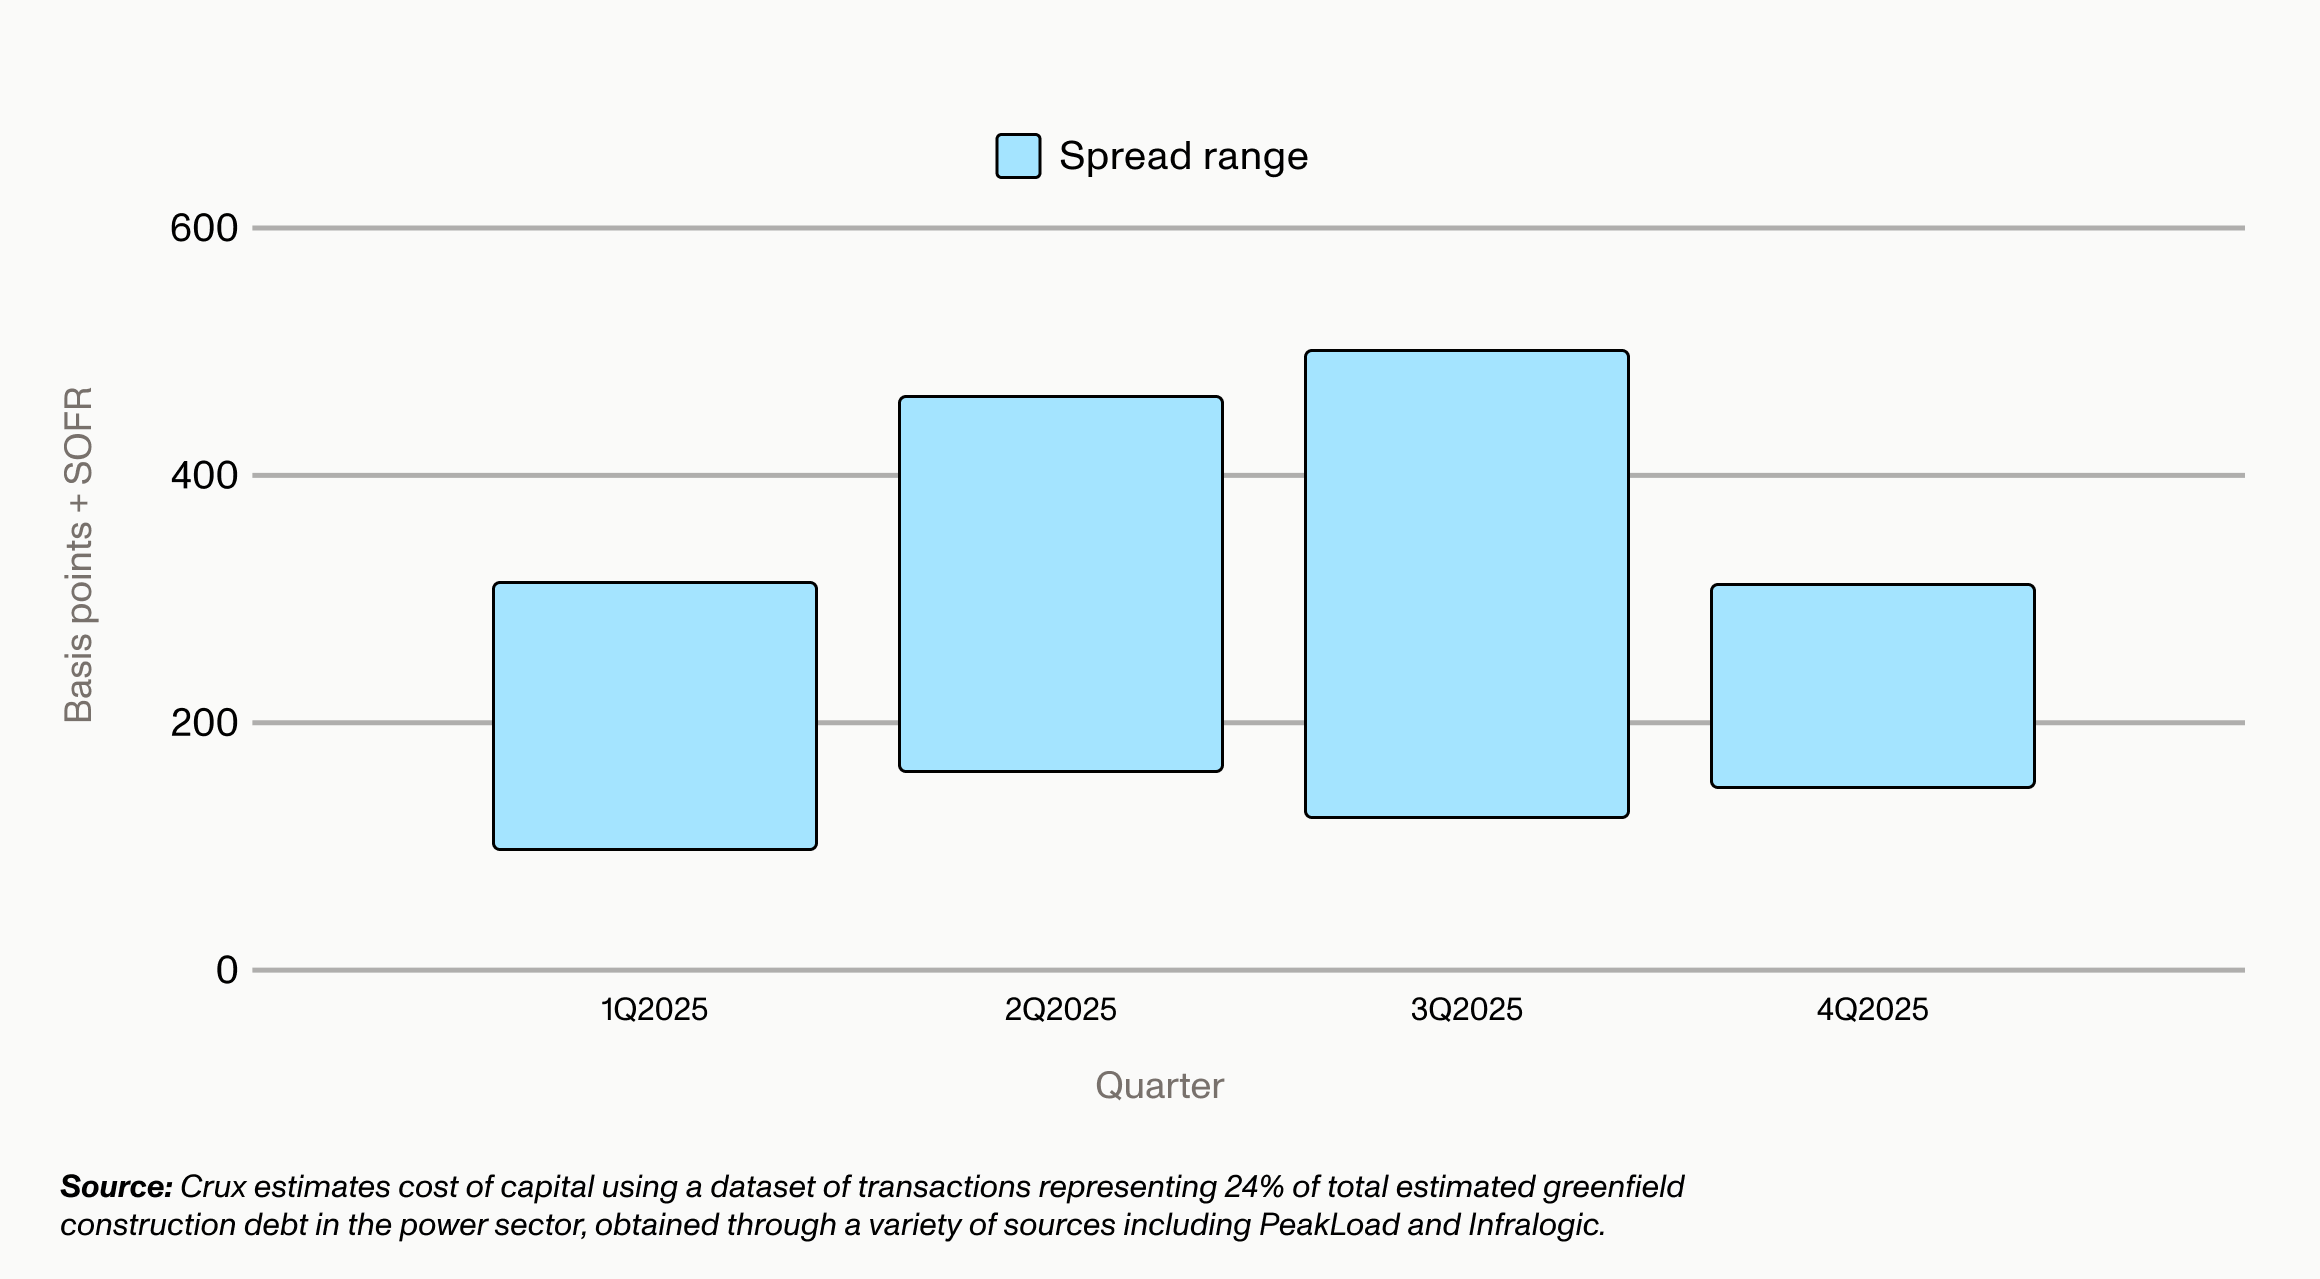
What I found particularly notable in the cost of capital was the narrowing of the transaction yield range for construction lending over the course of the year. Even as average costs held steady, the spread between the best and worst terms compressed, consistent with a market that's increasingly bifurcated: if you're in the club, terms are good. If you're not, options are limited and expensive.
Reported construction loan spread range over SOFR, 2025 (utility-scale solar and storage)
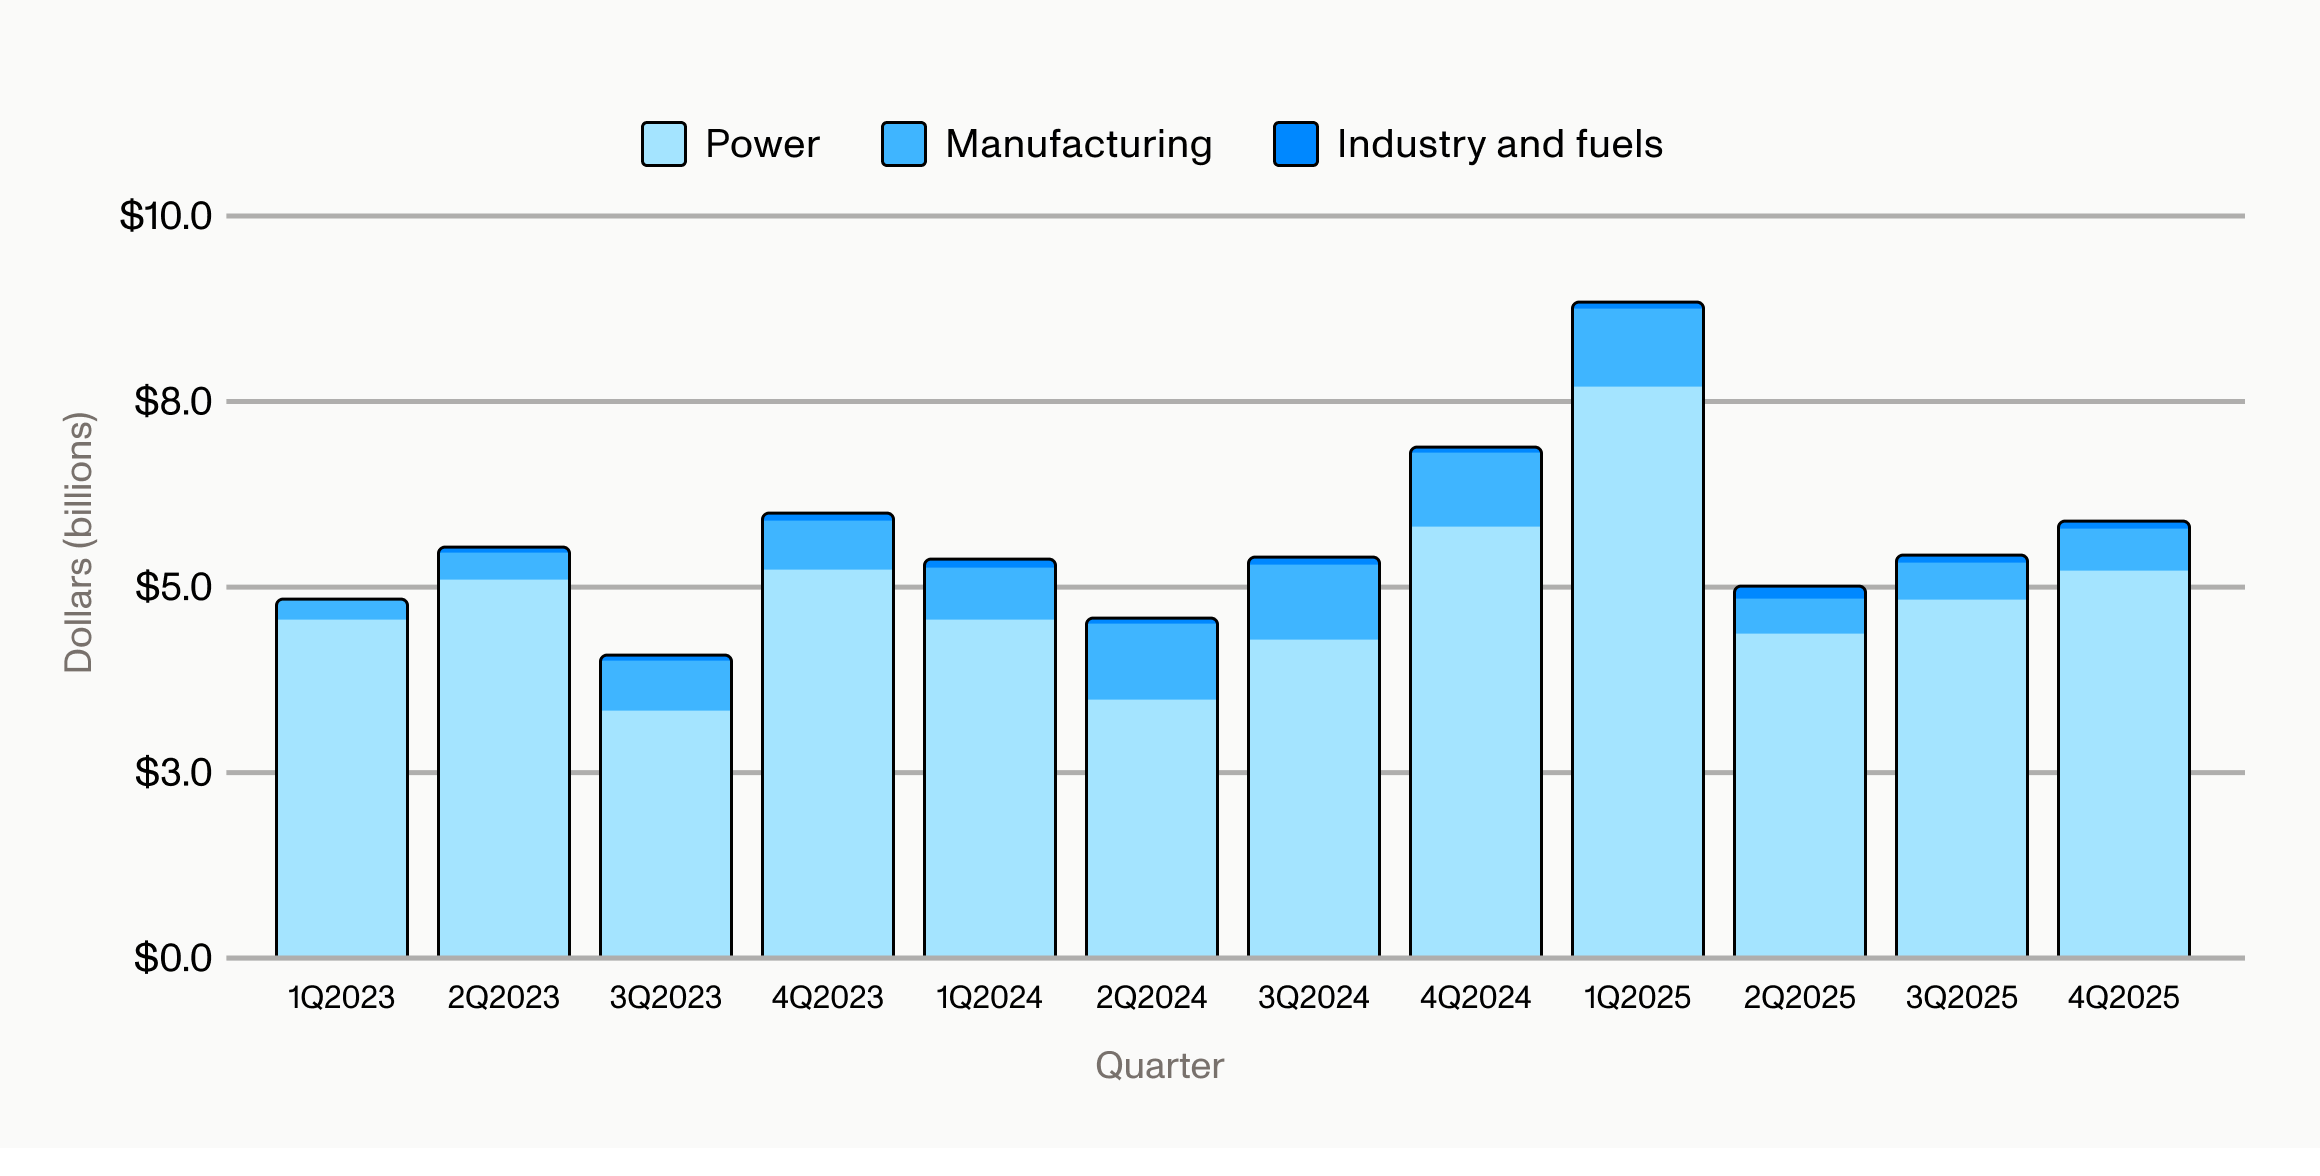
One of the most important stories in the report is the rise of bridge lending. Bridge loan volume grew 8.9% year over year to an estimated $25 billion, outpacing both construction lending growth and overall debt financing growth.
This growth was driven by the proliferation of new structures. Transferable credit bridge loans and preferred equity bridge loans joined the more established tax equity bridge loan market, giving developers options to manage the timing gap between capital deployment and tax credit monetization.
The same cost-of-capital divide was visible in bridge lending, too. Committed structures with high-quality buyers and experienced sellers saw pricing range from SOFR + 150–225 bps and advance rates of up to 98%, according to Mitsubishi UFJ Financial Group. Uncommitted bridge loans, generally only available to well-established sponsors, became very limited in 2025. They typically saw advance rates of ~70–75%, based on assumed tax credit sale prices of around $0.90.
Bridge lending by sector, 2023–2025
For lenders evaluating this space, bridge lending offers an increasingly attractive risk-return profile, particularly when backed by committed tax credit sale agreements. But it also requires a strong understanding of the tax credit market — how pricing is moving, which credit types carry more risk, and how deal structures vary by technology. That's where having a real-time view into the market becomes a significant advantage.
To the point above, tax credit transferability has become a core component of project finance, one that is increasingly underpinning a variety of tax credit bridge loan structures. If you're lending against tax credit proceeds, the 2025 pricing data deserves attention.
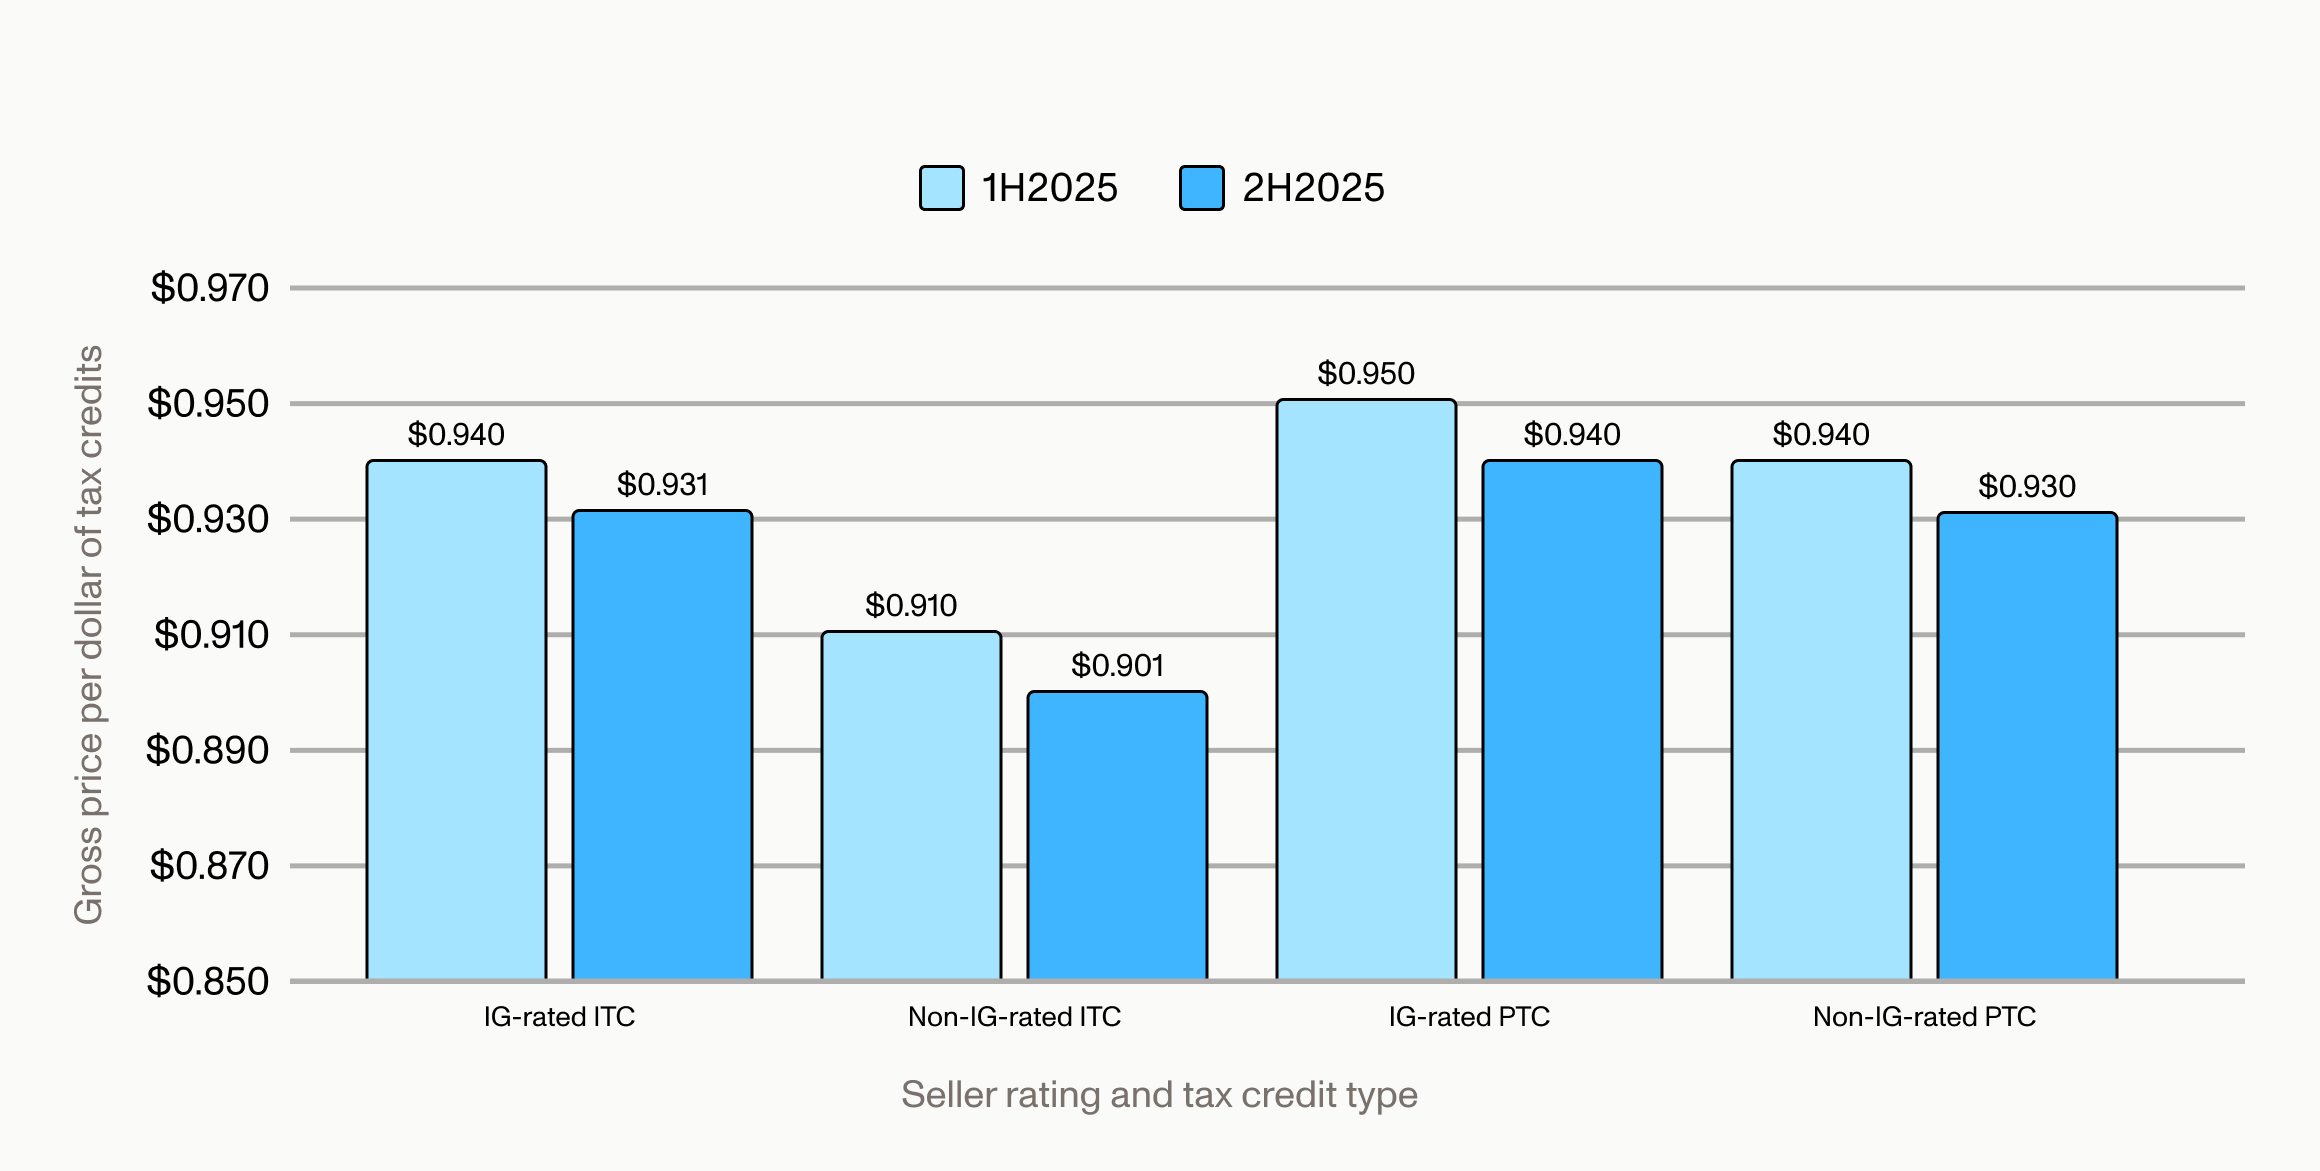
Tax credit monetization across tax equity, preferred equity, and transfers topped $63 billion in 2025, up 27% year over year. But pricing softened in the second half as many large tax credit buyers sat out due to uncertainty about their tax liabilities after the OBBB. Investment-grade investment tax credit (ITC) pricing averaged $0.931 in 2H2025, down from $0.940 in the first half. Production tax credit (PTC) pricing saw a similar decline.
Investment-grade versus non-investment grade ITC and PTC pricing, 2025
Critically, the softening was driven more by a reduction in average deal size than a collapse in deal count. Larger sponsors had difficulty moving big credit positions in 2H2025, while smaller buyers remained active. For lenders sizing bridge loans against expected tax credit proceeds, understanding this granularity — not just headline pricing, but deal-size dynamics, vintage-year mix, and buyer behavior — is essential for underwriting.
The report also flags that an estimated $8–10 billion in 2025-vintage tax credits remain available to transact in 2026. As buyers return to the market with greater clarity on their tax positions, pricing is likely to firm up — but the competitive dynamics are shifting, and the low prices of late 2025 may not stick around.
Looking ahead, I see several dynamics that matter for lenders:
The overall picture is one of a market that's maturing rapidly. Capital is available, but it's flowing to the projects and sponsors that can demonstrate execution readiness, strong risk profiles, and well-structured capital stacks. For lenders that can underwrite with flexibility and prudence in this environment, the opportunity set is significant.
That’s where Crux’s Debt Capital Markets team comes in. We bring deep market access to high-quality clean energy developers and manufacturers, giving lenders visibility into a diverse pipeline of lending opportunities across technologies, project stages, and capital structures. Contact us to learn more.