By Jim Alderson-Smith, Managing Director, Industry Coverage, Crux
Clean energy project finance in 2025 was defined by both uncertainty — spurring a flight to quality — and resilience. Even amid a volatile policy environment, shifting capital markets, and new compliance requirements, developers and manufacturers still deployed more capital than ever before. In our new report, The State of Clean Energy Finance: 2025 Market Intelligence Report, Crux estimates that total lending to clean power, fuels, and manufacturing projects reached approximately $120 billion, up nearly 6% year over year. Tax credit monetization across tax equity, preferred equity, and transfers topped $63 billion, a 27% increase from 2024.
These are strong headline numbers. But headlines don't capture what it actually felt like to finance projects in 2025 — or what the data tells us about how to position for 2026. I wanted to share my takeaways from the report and how I’m thinking about project finance in the year ahead.
Get our latest insights and favorite reads on the transferable tax credit market in your inbox.
If there was one theme that cut across every section of the market last year, it was bifurcation. Capital was abundant in 2025, but it was not equally available. Sponsor experience, project type, and progress in the project development cycle determined not just whether developers could get financing, but at what cost.
Bank debt remained the cheapest source of project finance capital, but banks grew more selective. Experienced sponsors building fully contracted utility-scale solar projects accessed construction loans at spreads as low as 137 basis points (bps) above the secured overnight financing rate (SOFR). On the other end of the spectrum, emerging developers and less-established technologies faced pricing as high as SOFR + 1,100, often from private credit lenders with more flexible but more expensive structures. The range between bank-financed utility solar and private credit–financed manufacturing projects spanned nearly 1,000 basis points.
The divide showed up across every debt product. In pre-notice-to-proceed (pre-NTP) capital, utility-scale solar from experienced sponsors priced at SOFR + 400–900, while commercial and industrial (C&I) solar, residential solar, and storage projects ranged from SOFR + 600–1,100. Newly eligible technologies such as renewable natural gas (RNG), advanced manufacturing, and critical minerals generally saw limited capital availability.
Bridge lending was the fastest-growing segment of greenfield project debt, up nearly 9% year over year to an estimated $25 billion. New structures — transferable credit bridge loans (TRBLs) and preferred equity bridge loans (PEBLs) — expanded the menu of options, but the most favorable terms still went to experienced sponsors with committed structures and high-quality buyers. Uncommitted bridge loans were very limited in 2025.
Illustrative access to capital by provider type and project characteristics

How should developers and manufacturers think about this division in the cost of capital? Cost of capital is now a first-order competitive differentiator, not just a line item. The gap between what a top-tier sponsor pays and what a mid-market developer pays can materially change project economics. That makes assembling the right capital stack — choosing the right mix of debt, tax equity, preferred equity, and tax credit monetization, and understanding how they work in concert with one another — paramount.
Crux estimates that total tax credit transfer volume reached nearly $42 billion in 2025, up from $28 billion in 2024. But it was really a tale of two halves.
The majority of deal volume occurred in the first half of 2025, which exceeded the second half by about 1.4x, a contrast to the seasonality curves we’ve observed in previous years. The passage of the One Big Beautiful Bill (OBBB) in July introduced material uncertainty into corporate tax liabilities. Many larger buyers pulled back to reassess their 2025 tax positions. The result: both transaction volume and average deal price declined in the second half of the year. Average pricing for investment-grade investment tax credits (ITCs) dipped from $0.940 to $0.931.
Quarterly deal volume in the tax credit market by tax credit vintage year, 4Q2023–4Q2025
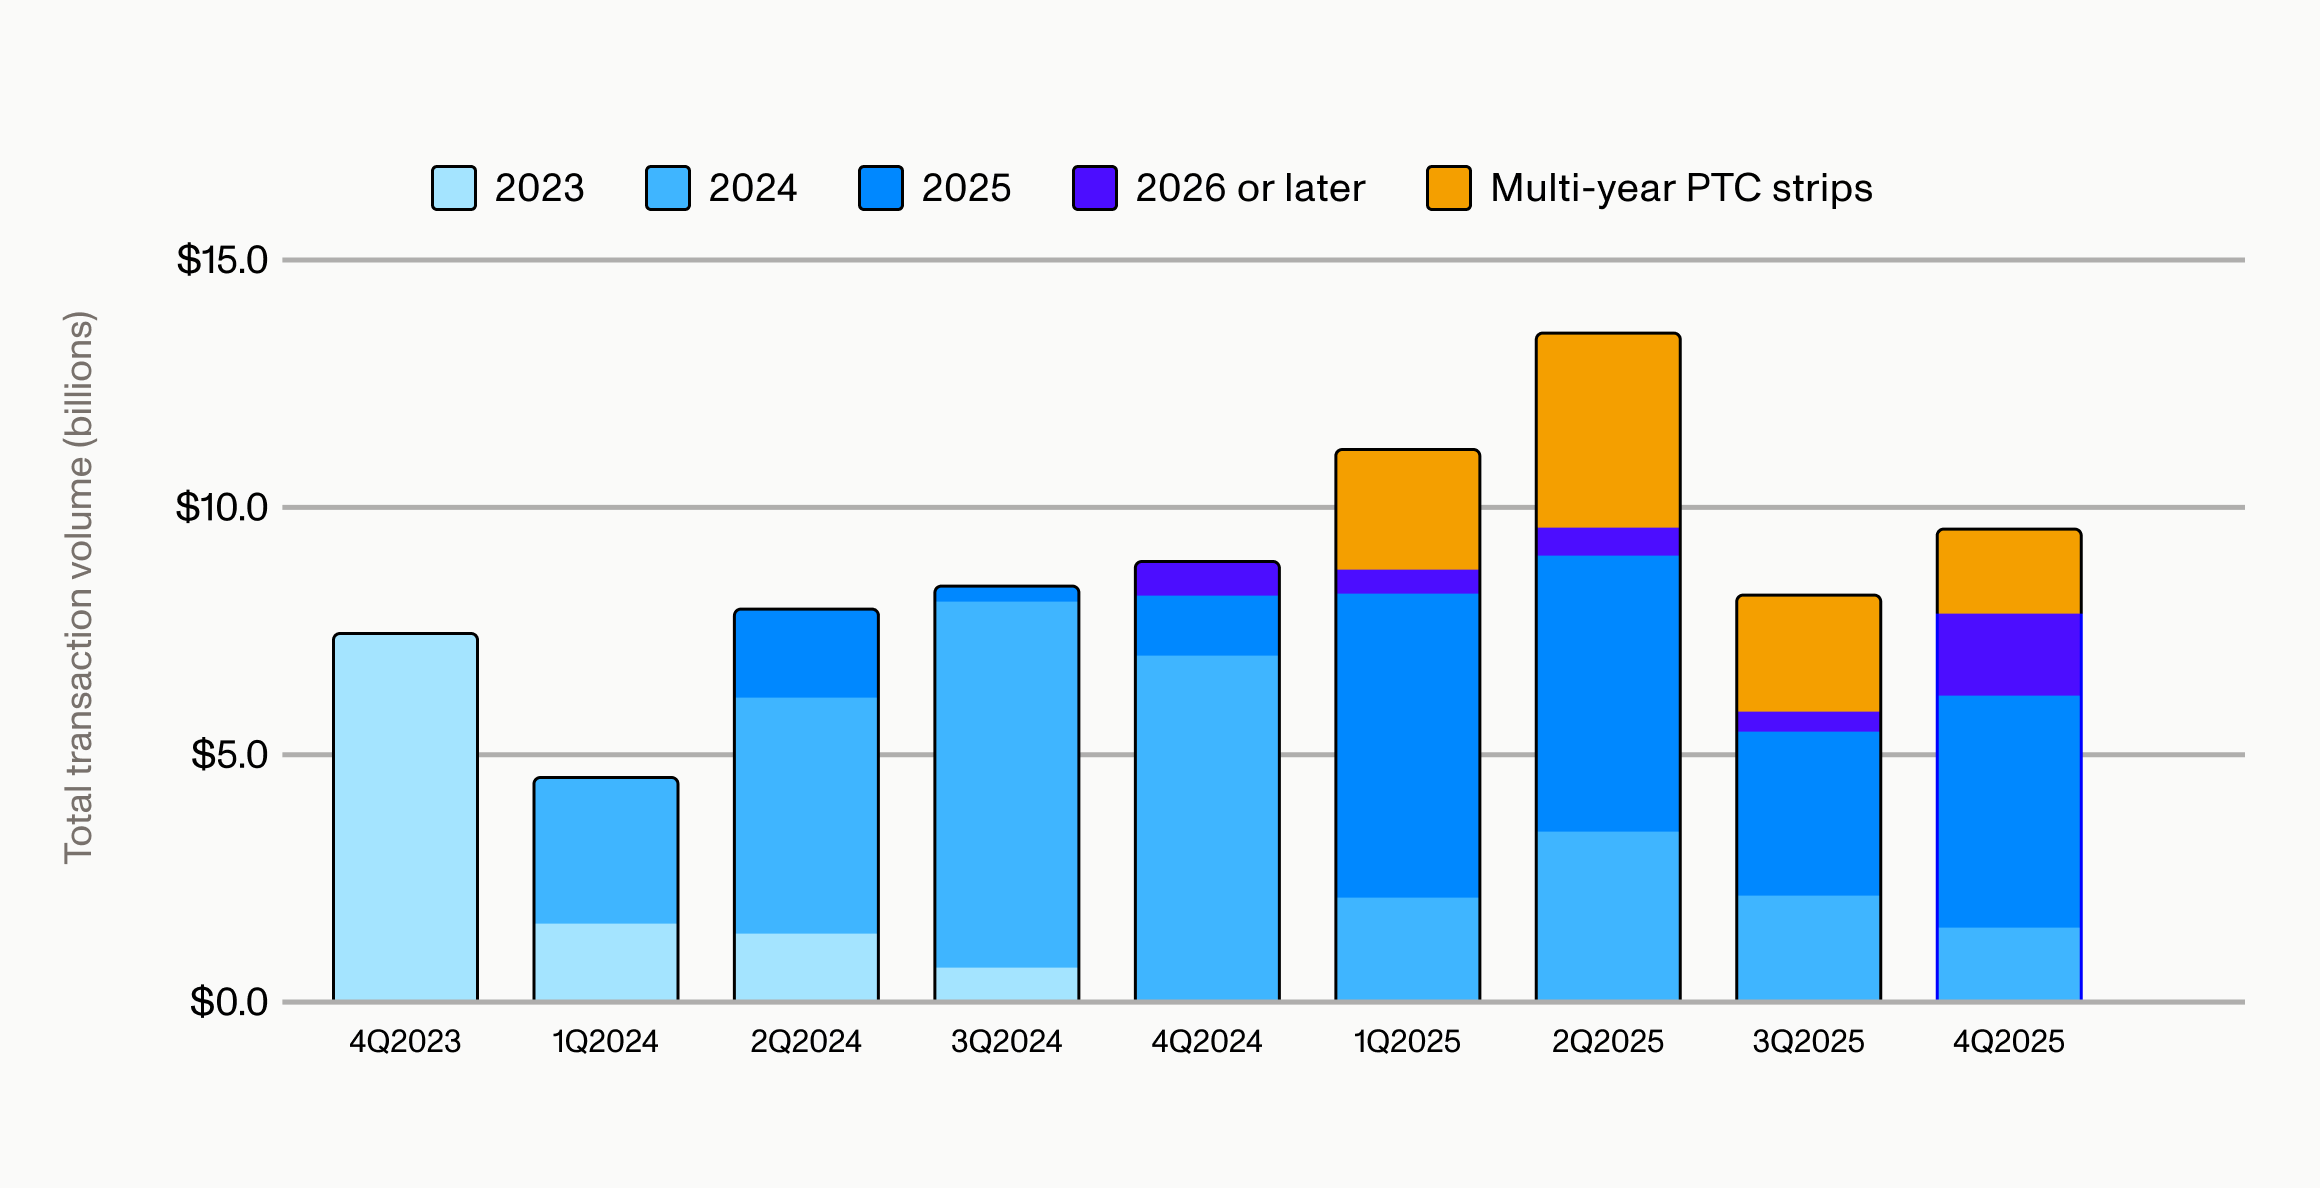
Importantly, deal count held up. The slowdown was driven more by shrinking deal sizes than by buyers leaving the market entirely. Smaller buyers with more stable tax positions stayed active, while larger corporates took a wait-and-see approach. Consequently, large sponsors, who commanded the most market share in the first half of the year, faced greater difficulty moving large credit positions in 2H2025 and often had to settle for lower prices or more restrictive terms.
We believe the slowdown in the second half of 2025 was driven by timing and buyer reassessment of tax liability, versus a fundamental decline in demand. The vast majority (80%) of buyers now have clarity on their 2025 tax demand or expect to by the end of 1Q2026, and we’re starting to see larger corporates return to the market in search of bigger credit tranches.
Developers and manufacturers who sat on their inventory to wait for better pricing are coming back, as well. Crux estimates that $8–10 billion in 2025-vintage tax credits remain available to transact in 2026. These are premium credits, and developers are expecting higher prices. We are seeing the market tighten — Crux forecasts a potentially substantial rebound in tax credit pricing in 2026, especially for solar ITCs and §45X advanced manufacturing credits. Prices could exceed 1H2025 pricing levels due to competition among buyers for a finite pool of credits.
Two policy dynamics will define the project finance environment through 2026 and beyond: the large volume of safe-harbored projects and the implementation of foreign entity of concern (FEOC) rules.
The OBBB accelerated the expiration timeline for wind and solar tax credits — projects must begin construction by July 4, 2026 to qualify for the safe harbor and remain eligible for tax credits. Crux estimates that developers have safe-harbored approximately 170 GW of wind and solar capacity (147 GW of solar and 23 GW of wind). Roughly 70 GW of that qualifies for legacy §48/§45 tax credits, which are exempt from FEOC requirements.
Estimated total volume of safe-harbored wind and solar, 2025

At current deployment rates, this pipeline is sufficient to sustain several years of project development, giving developers and their capital partners a meaningful buffer against near-term policy uncertainty. But the window is closing. Developers that haven't yet locked in their safe harbor positions yet don’t have much time left to do so, and we’ll likely see a significant amount of activity around beginning-of-construction (e.g., module purchases) and safe harbor strategies in the first half of 2026. That could lead to challenges — for instance, transformers selling out — if too many developers are scrambling to start physical construction.
FEOC restrictions went into effect January 1, 2026, and touch virtually every part of the capital stack. Lenders were the first to incorporate FEOC risk into underwriting, and only about 10% of tax equity investors in Crux’s survey reported actively pursuing tech-neutral tax credits, which are subject to FEOC requirements. The rest are waiting for clearer guidance from the Internal Revenue Service (IRS), particularly on the ownership test.
In the transfer market, tech-neutral §48E credits are already pricing $0.01–0.02 below legacy §48 credits for similar projects. This discount reflects not just FEOC uncertainty but also the broader reality that legacy credits carry less compliance risk and more established market infrastructure.
For developers, it’s critical to note that equipment-sourcing decisions, supply chain documentation, and ability to demonstrate compliance with interim prohibited foreign entity guidance is now directly tied to cost of capital and speed to close. Developers need to engage their legal and tax advisors now, start mapping their supply chains, and build their compliance packages.
Manufacturers need to pay particular attention to how FEOC rules interact with §45X advanced manufacturing tax credits. Starting in 2026, manufacturers must meet material assistance cost ratio (MACR) thresholds that vary by component type — 50% for solar and inverters, 60% for batteries, and 85% for wind — and tighten annually. The manufacturers best positioned to capture the pricing upside we expect to see in 2026 will be those who can present buyers with a clean FEOC compliance package, including MACR calculations, supplier certifications, and clear documentation of their certification pathway.
In a market like we’re anticipating in early 2026 where buyers are competing for a finite supply of tax credits and pricing for premium §45X credits could rebound above first-half 2025 levels, the ability to reduce friction for buyers in the diligence process isn’t just a compliance requirement — it’s also a path to streamlined execution and better deal outcomes.
That advantage extends to lending, as well. Lenders are increasingly incorporating FEOC compliance into their underwriting for manufacturing facilities, and manufacturers who can demonstrate compliance upfront are better positioned to access capital on favorable terms. In an environment where cost of capital is already a key differentiator, having FEOC documentation ready before you go to market can meaningfully affect the success and economics of a capital raise.
Read more: Survey of FEOC readiness among clean energy developers and manufacturers
The patterns from 2025 point to a 2026 defined by continued growth but sharper differentiation. Crux's base case projects total capex rising 7.5% year over year to $125 billion, with an upside scenario exceeding $150 billion driven by accelerated solar and storage deployment.
The developers and manufacturers best positioned for 2026 will be those that treat capital strategy as a core competency, not an afterthought. That means understanding how to optimize options across the full stack: where bridge lending fits, how hybrid tax equity is changing capital structures, which tax credit strategies align with your timeline, and how to navigate FEOC compliance without losing momentum.
These are the conversations Crux has with developers and manufacturers every day. If you'd like to discuss how any of these dynamics apply to your portfolio, reach out to our team.
Read the full 2025 Market Intelligence Report here.